Monitoring
From the Monitoring page, you can view system information, events,
objects, and video through a series of layouts. You can also access the following pages:
- Manual Actions
- Intrusion Zones
- Audit and Journal
- Devices
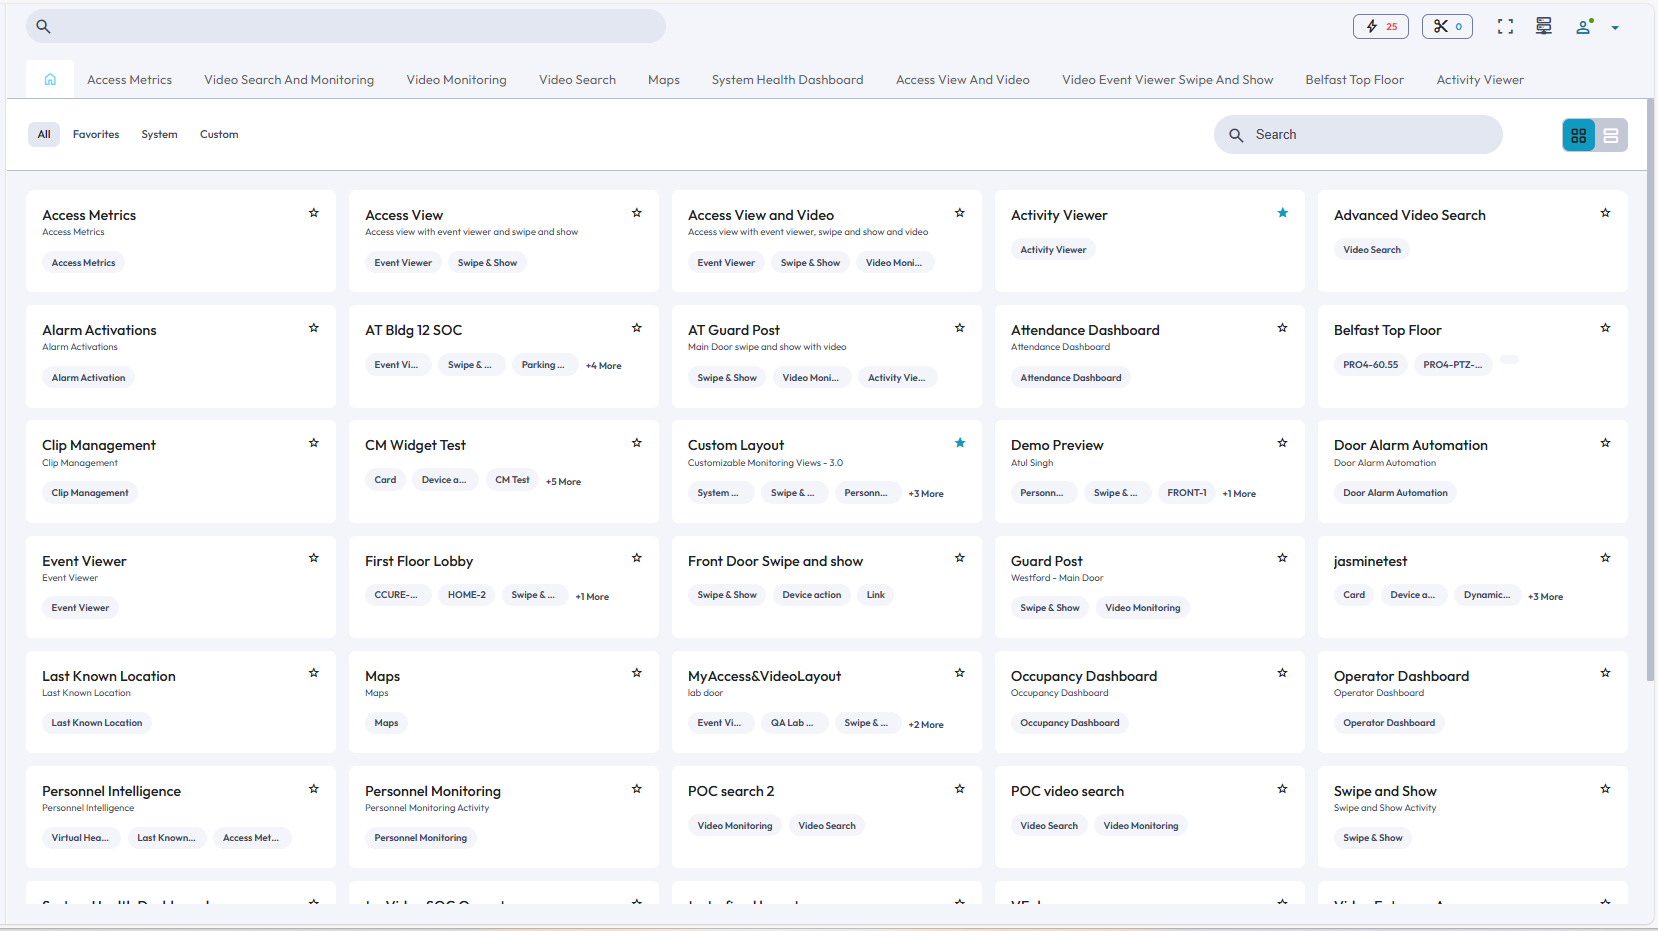
On the Layouts page, on the Home tab, you can view the system layouts and
custom layouts for C•CURE IQ. In the list of layouts, you can view
the layout name, layout description, and the modules that the layout contains. For example,
the Access View and Video layout contains the following modules:
- Event Viewer
- Swipe and Show
- Video Monitoring
You can click the star icon to add a layout to the Favorites list. Click a
layout to open that layout. Recently opened layouts appear as tabs in the Layouts page.
Click the home icon to return to the Layouts home tab. You can also scroll through the list
of web layouts, or use the search field to search for a web layout.
Note: You can also type layout module names into the search field, if
you want to search for layouts that contain a specific module.
If you create any
custom web layouts, they also appear in this list. For more information about creating
custom web layouts, see Layouts.C•CURE IQ includes the following pre-configured
system layouts:
- Access Metrics
- Access View
- Access View and Video
- Alarm Automation Dashboard
- Alarm Dashboard
- Attendance Dashboard
- Clip Management
- Event Viewer
- Last Known Location
- Maps
- Occupancy Dashboard
- Operator Dashboard
- Personnel Intelligence
- Personnel Monitoring
- Swipe and Show
- System Health Dashboard
- Video Monitoring
- Video Search
- Virtual Headcount