System Health Dashboard
The System Health Dashboard provides status information about the application server, hardware devices that are connected to C•CURE IQ, and access control information relevant to the facility. Information is displayed in different panels that are called cards. For example, server performance, operating system, memory, and CPU usage. The other panels display.
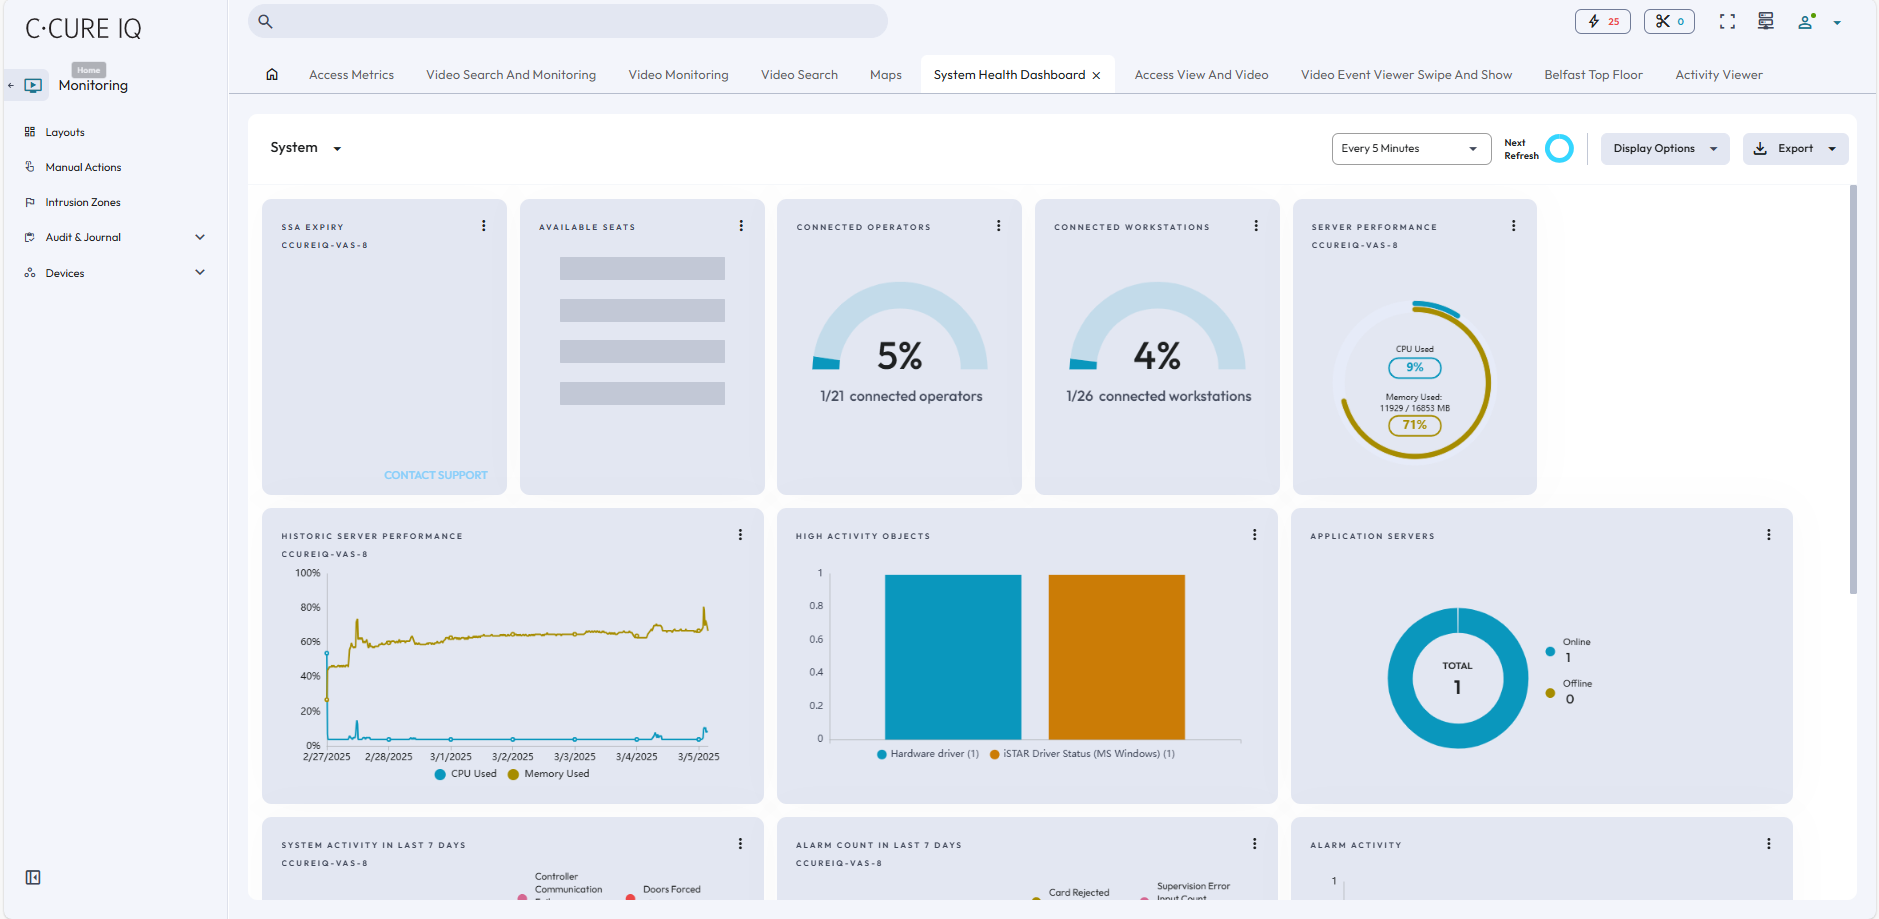
The System Health dashboard is divided into three categories - System, Device, and Storage. On the toolbar, you can select how often the dashboard refreshes, which cards display for each category, and export dashboard information. Each category contains cards that are read-only, and provide the following information.
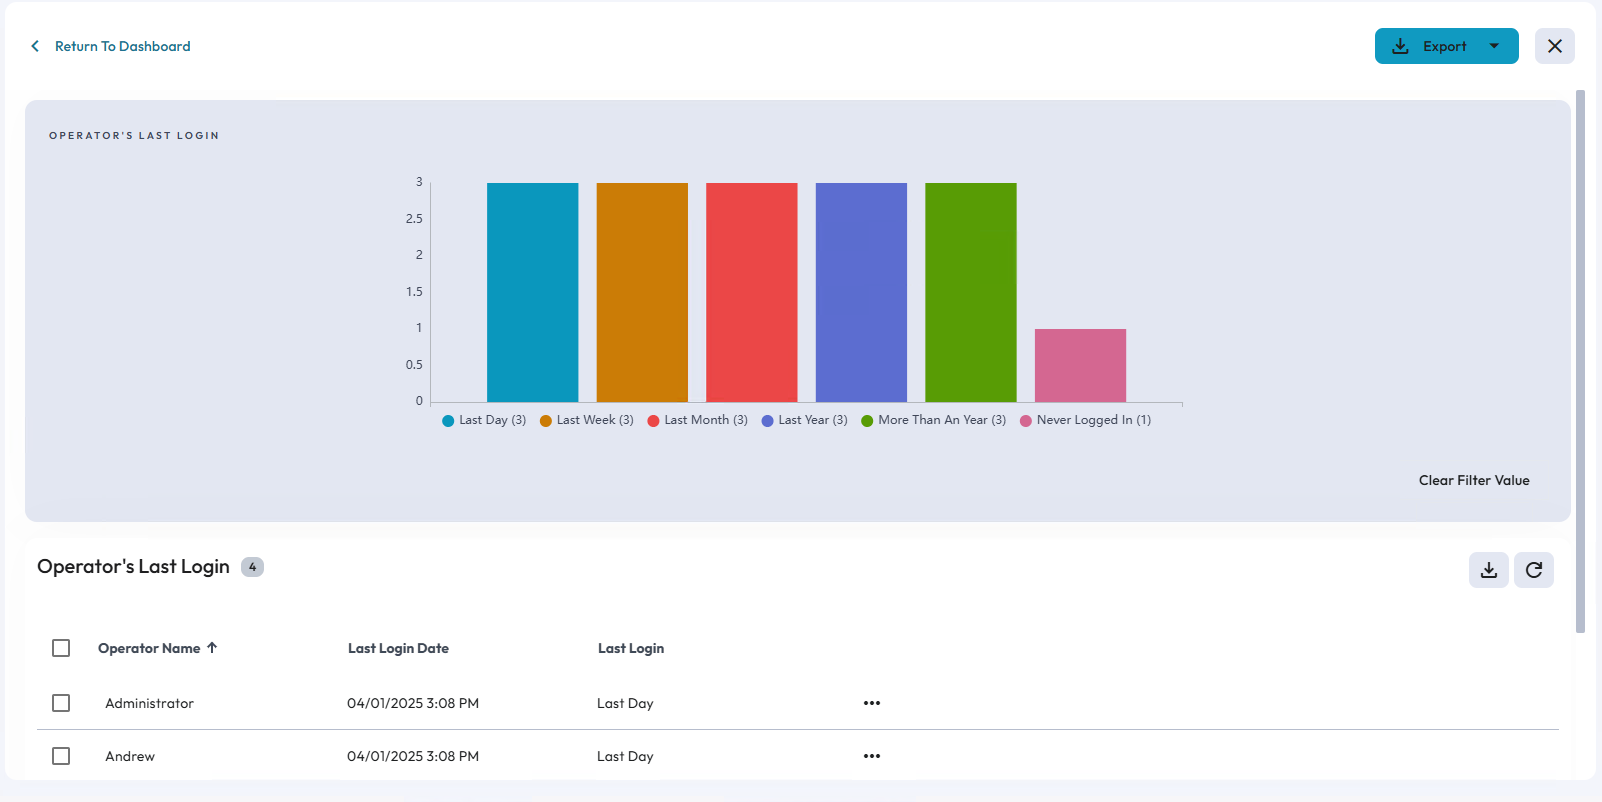
To view information from a system health card, click the Menu icon in the top-right corner of the card. A popup window appears, where you can expand the card, pin the card, apply filters, and download the card information in .PDF or .CSV format. If you expand the card, you can view detailed card information in chart and list view.
System information
- SSA Expiry
- The number of days remaining in your software service agreement.
- Available Seats
- The number of operator accounts available on the C•CURE license.
- Connected Operators
- The number of operators currently logged on to C•CURE IQ.
- Connected Workstations
- The number of workstations connected to the system, either through the desktop client or web client.
- Server Performance
- The current CPU usage and memory usage for the victor Application Server.
- Historic Server Performance
- Displays a graph of CPU usage and memory usage over several days.
- High activity Objects
- Displays objects with high activity levels in real time. An object is considered high activity if they have more than 1000 reads or writes.
- Application Servers
- Displays the current CPU and memory usage for the victor Application Server.
- System Activity in the last 7 days
-
- Controller Communication Failures: Displays the controllers that had connection or communication failures in the last seven days.
- Controller Tamper: Identifies controllers that were tampered with in the last seven days.
- Doors Held Open: Identifies the doors that were held open in the last seven days.
- Doors Forced: Identifies the doors were forced in the last seven days.
- Doors in Maintenance Mode: Identifies the doors that are currently in Maintenance Mode.
- Events in Maintenance Mode: Identifies the events that are currently in Maintenance Mode.
- Alarm Count in the last 7 days
-
-
Card Rejects: The number of card rejects that occurred in the last seven days.
-
Events Acknowledged: The number of acknowledged events that occurred in the last seven days.
-
Supervision Error: The total number of activations generated by inputs.
-
Journal Video Alarm: The number of video alarms raised in the last seven days.
-
- Alarm Activity
- Displays the number alarms raised on each day in the last seven days.
- Latency over 5 sec
- Displays the number of events that exceeded five seconds in the last seven days.
- Operator’s last login
- Displays operators based on their most recent log on time.
Device information
- Video Recorders
- The number of online and offline video recorders.
- Video Cameras
- The status of connected videos cameras, such as Normal, Offlline, and Unknown.
- Controllers
- The number of controllers that are in Offline, Online, Unknown, and Maintenance Mode states.
- Doors
- Displays doors categorized by monitor states, such as Forced, Held Open, Open, Locked, Unlocked, No Access, Unknown, and In Maintenance.
- Inputs
- Displays inputs categorized by monitor states, such as Disabled, Supervision Error, Armed, Disarmed, Active, Update Disabled, Unknown, and In Maintenance.
- Outputs
- Displays outputs categorized by monitor states, such as Disabled, Active, Inactive, Unknown and In Maintenance.
- Maintenance Mode
- Displays objects that are in Maintenance Mode.
Storage information
- Recorded video on VideoEdge
- The average duration of recorded video in days for all connected VideoEdge recorders.
- VideoEdge Recorders Storage
- The storage status of every VideoEdge recorder in your system. The storage status can be Normal, Degraded, or At Risk.
- Disk Drives
- The total memory available for video recorder disk drives.
- Total Video Clips
- The number of video clips downloaded on video recorders.
- Connected Database
- The number of databases connected to C•CURE IQ with a status of Backed Up or Not Backed Up.