Dashboard overview
| Callouts | Description |
|---|---|
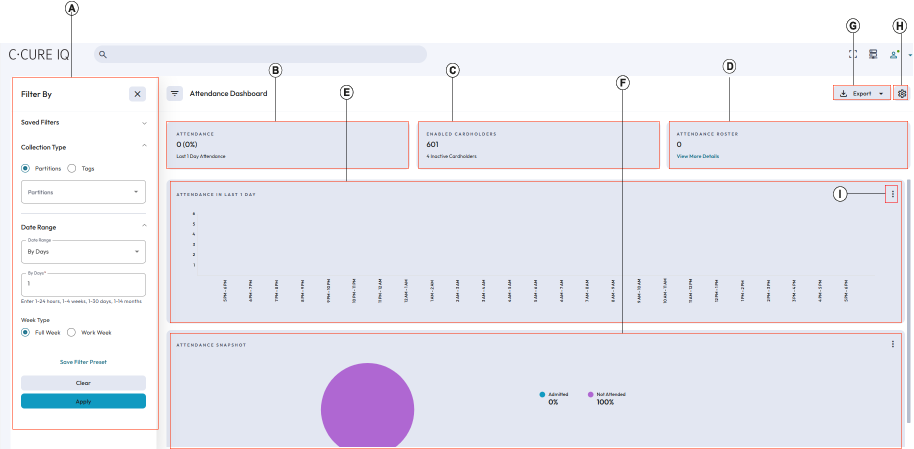
| A | Filter by: Narrow downs the search results based on the filters selected. |
| B | Attendance: Shows the number of personnel with percentage of attendance for last one day. |
| C | Enabled Cardholders: Shows the data for active or inactive
credentials belongs to the personnel. Personnel partitions should be equal to the filtered partitions (via Partitions/tags). |
| D | Attendance Roster: Shows the details of individual person who has
swiped the card. Clicking View more details shows the individual person details like name, partition name, personnel Type, and average frequency (Visiting frequency). You can also choose other custom fields to display in the table. |
| E | Attendance in last 1 day: Shows attendance data chart for the last one day on hourly basis. The x-axis represents time slots across a 24-hour period and the y-axis represents the number of personnel. |
| F | Attendance Snapshot: Shows attendance data in the form of pie
chart. You can hover over Admitted and
Not Attended options to view the count of
the personnel for the respective options. Click more button (three dots available in the top right of ATTENDANCE SNAPSHOT section) to view the attendance snapshot in a tabular format. |
| G | Export: Export the details in PDF or CSV format.
|
| H | Configuration: Set the value for top 5 or 10 personnel with the highest and lowest attendance. |
| I | View As Table: Shows the table view of attendance data. In tabular format, you can
view the details for Partitions, Personnel Count, and Total
(Occupancy Limit) for the partitions. You cannot modify these
columns. Sorting of the column will apply only to the current page. For example, if you set the page size to 20, the system displays only 20 partitions at a time when there are 50 partitions. When sorting is applied, it affects only these 20 visible partitions, not the entire set of 50 partitions. You can refresh the page for the fresh load of attendance data. |