Occupancy Dashboard
Occupancy Dashboard allows you to analyze and visualize the utilization of a physical space, such as in a work place or in a building. It combines data from various sources to provide a comprehensive overview of space usage and help organizations optimize their operations.
Occupancy Dashboard tracks the number of people in a specific organization. It provides an insights into space usage and helping organizations understand their attendance and space utilization patterns. It provides insight into how well the organization utilizes space on an hourly, daily, weekly, and monthly basis.
- Navigate to the Security Intelligence module menu (either
from the left panel or from the C•CURE IQ landing page) and click
Occupancy Dashboard.
Or
- Navigate to Monitoring module menu. Click Home icon and search for the Occupancy Dashboard.
- No license - UI will display the error message
- Default month selected will be 1 month, if the license type is 1 (Default license supports 1 month data).
- Default month selected will be 1 month, if the license type is 2 (Premium license supports 14 months data).
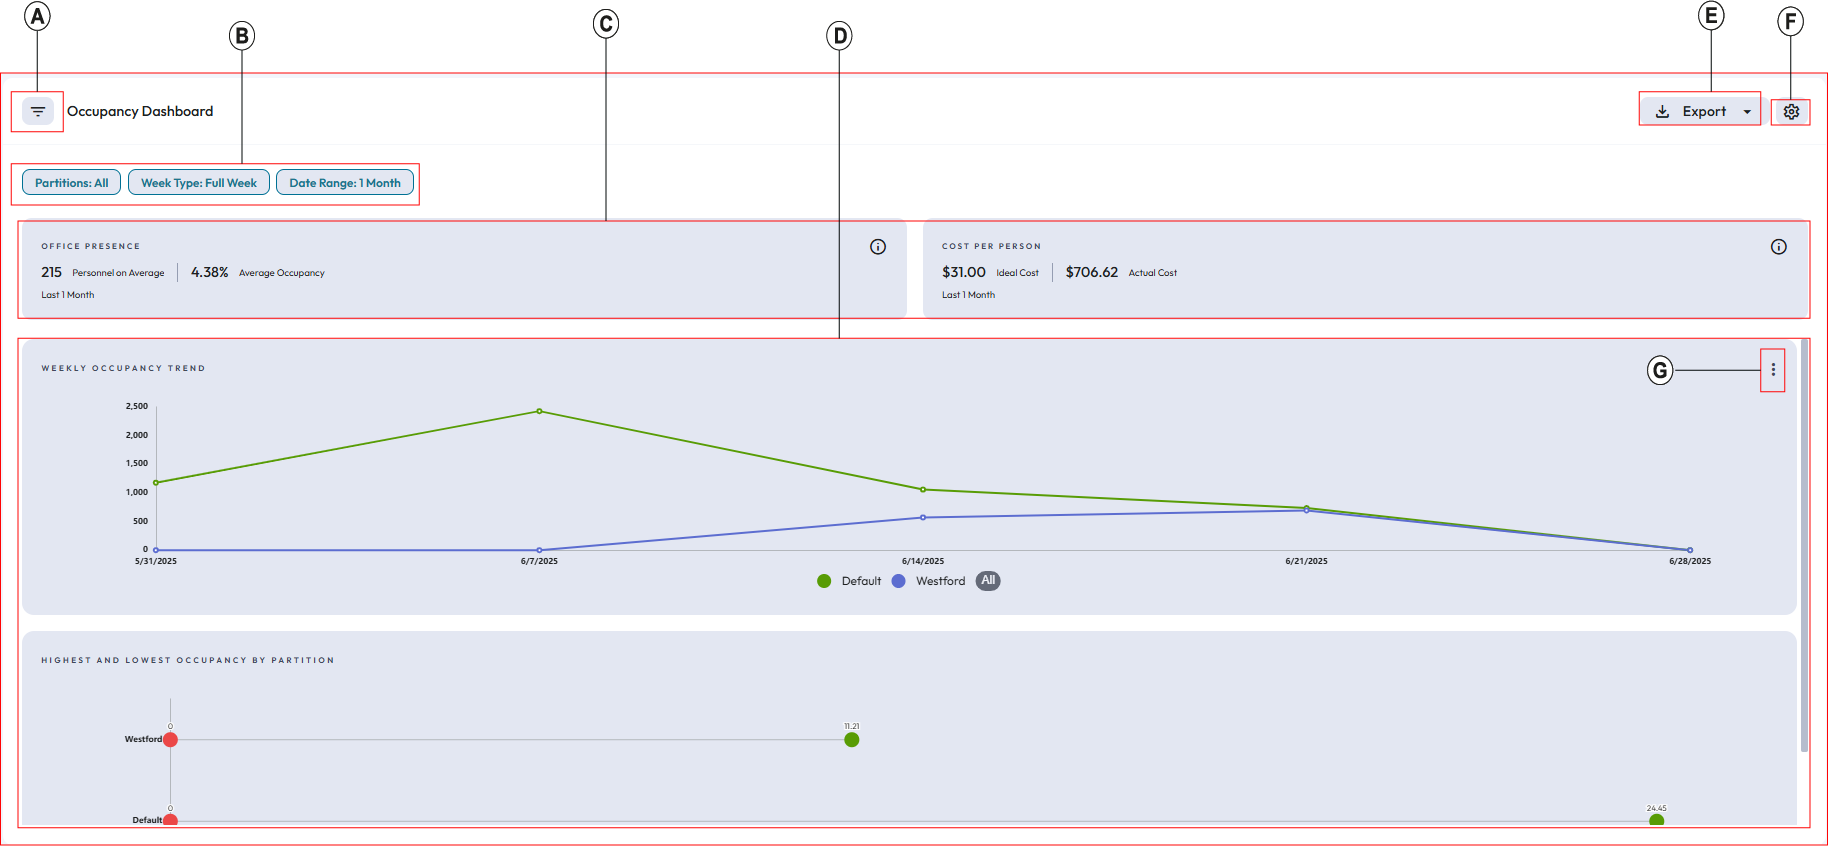
Following are the elements and the description of Occupancy Dashboard:
| Callout | Description |
|---|---|
| A | Show or hide the filtering tools. Narrow downs the search results based on the filters selected. |
| B | Filter chips: Once you specify the filters and apply them, you can view all the selected filters on the top bar of the filtered data window after closing the Filter By pane. |
| C | Data card showing the details about personnel presence in office and cost information for personnel. |
| D | Graphical representation of occupancy data. In graphical representation, you can see
weekly occupancy trend for the personnel occupancy and highest &
lowest occupancy for the selected partition. Note: The selected filter determines the graph sections. |
| E | Export the occupancy data in PDF or CSV format. In CSV format, data exports in the
tabular format. Note: Charts will not show if
the export in tabular format. In PDF, the report exports in the same way you see in the UI. In PDF, you can download data in the form of a chart; however, if you select tabular format, then you can export data in tabular format. |
| F | Configuration for the number of partitions to display. You can set up number of partitions to
display in the dashboard as 5 or 10. By default, the system sets
this value to 5. Note: This
Configuration setting is only
applicable for charts. In the table view, the system displays
all the partitions based on the filter. |
| G | To change the view in tabular format from graphical format and vice versa. You cannot modify the occupancy information available in tabular format. You cannot add or remove any other section or columns to the table. Sorting of the column will apply only to the current page. For example, if you set the page size to 20, the system displays only 20 partitions at a time when there are 50 partitions. When sorting is applied, it affects only these 20 visible partitions, not the entire set of 50 partitions. |