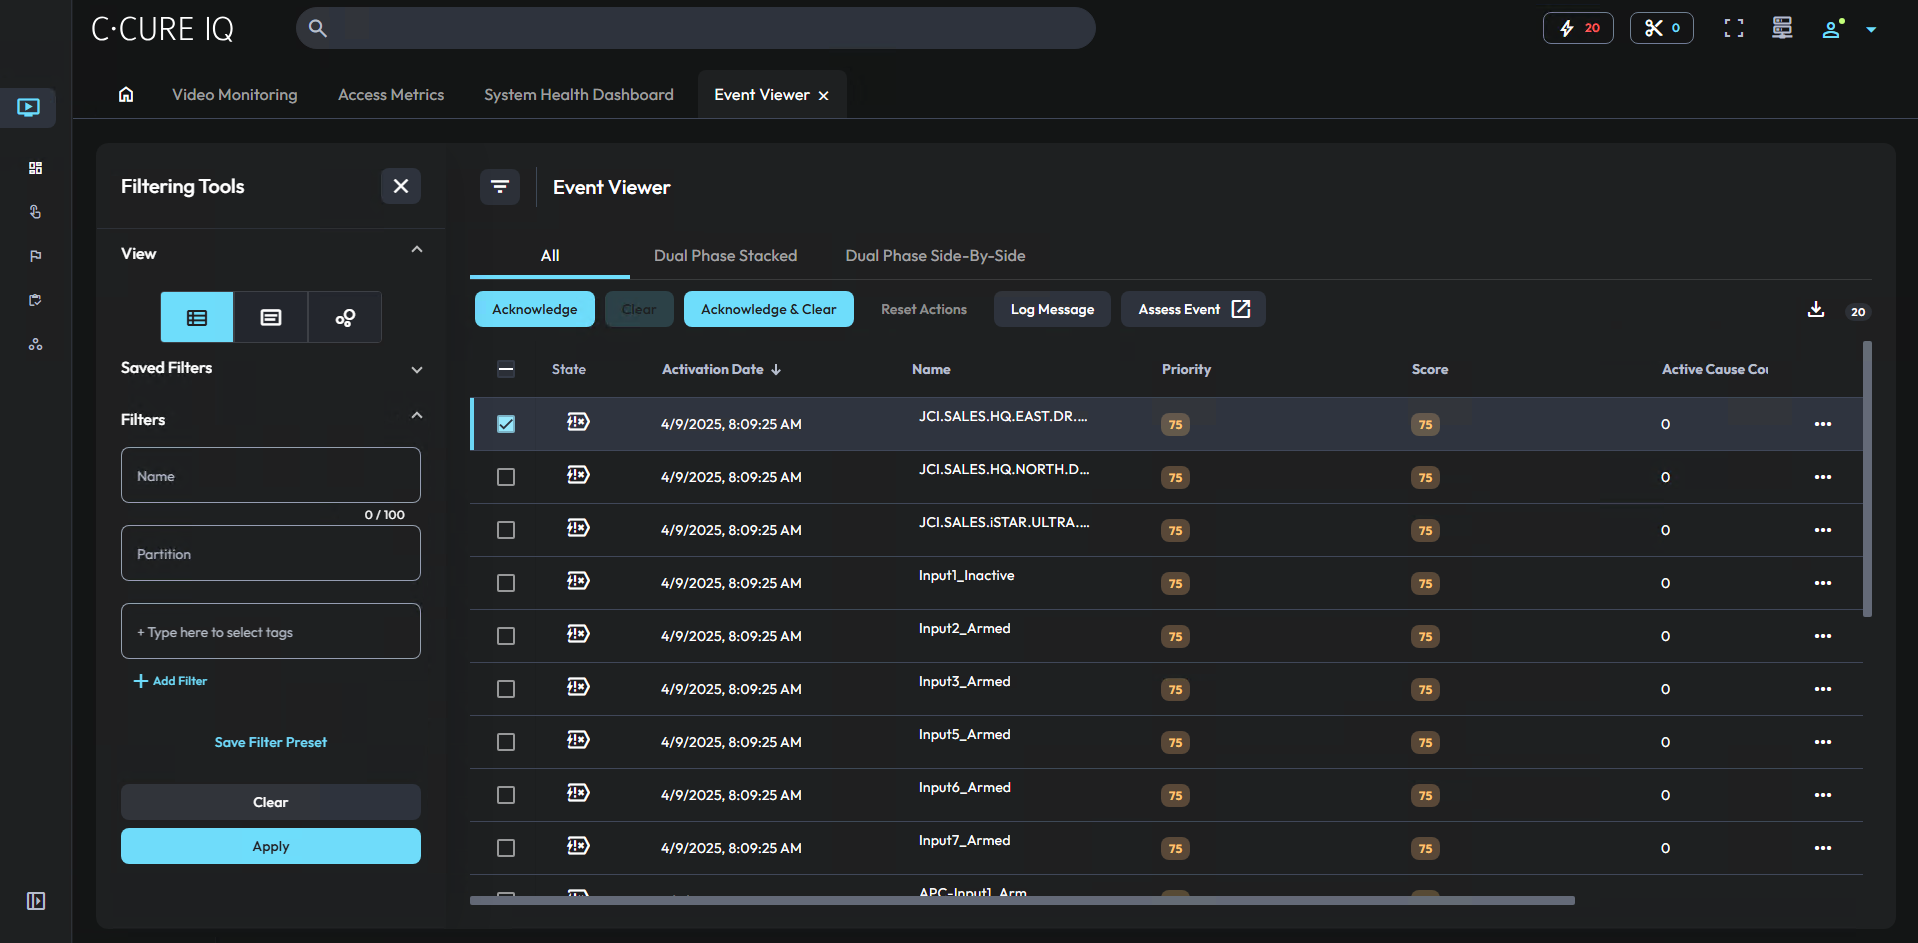
List view
In List view, events appear in a dynamic list. To customize the event information in List view, you can use the following options:
- Apply filters to the list
- Sort the list by one of the list columns
- Show or hide list columns
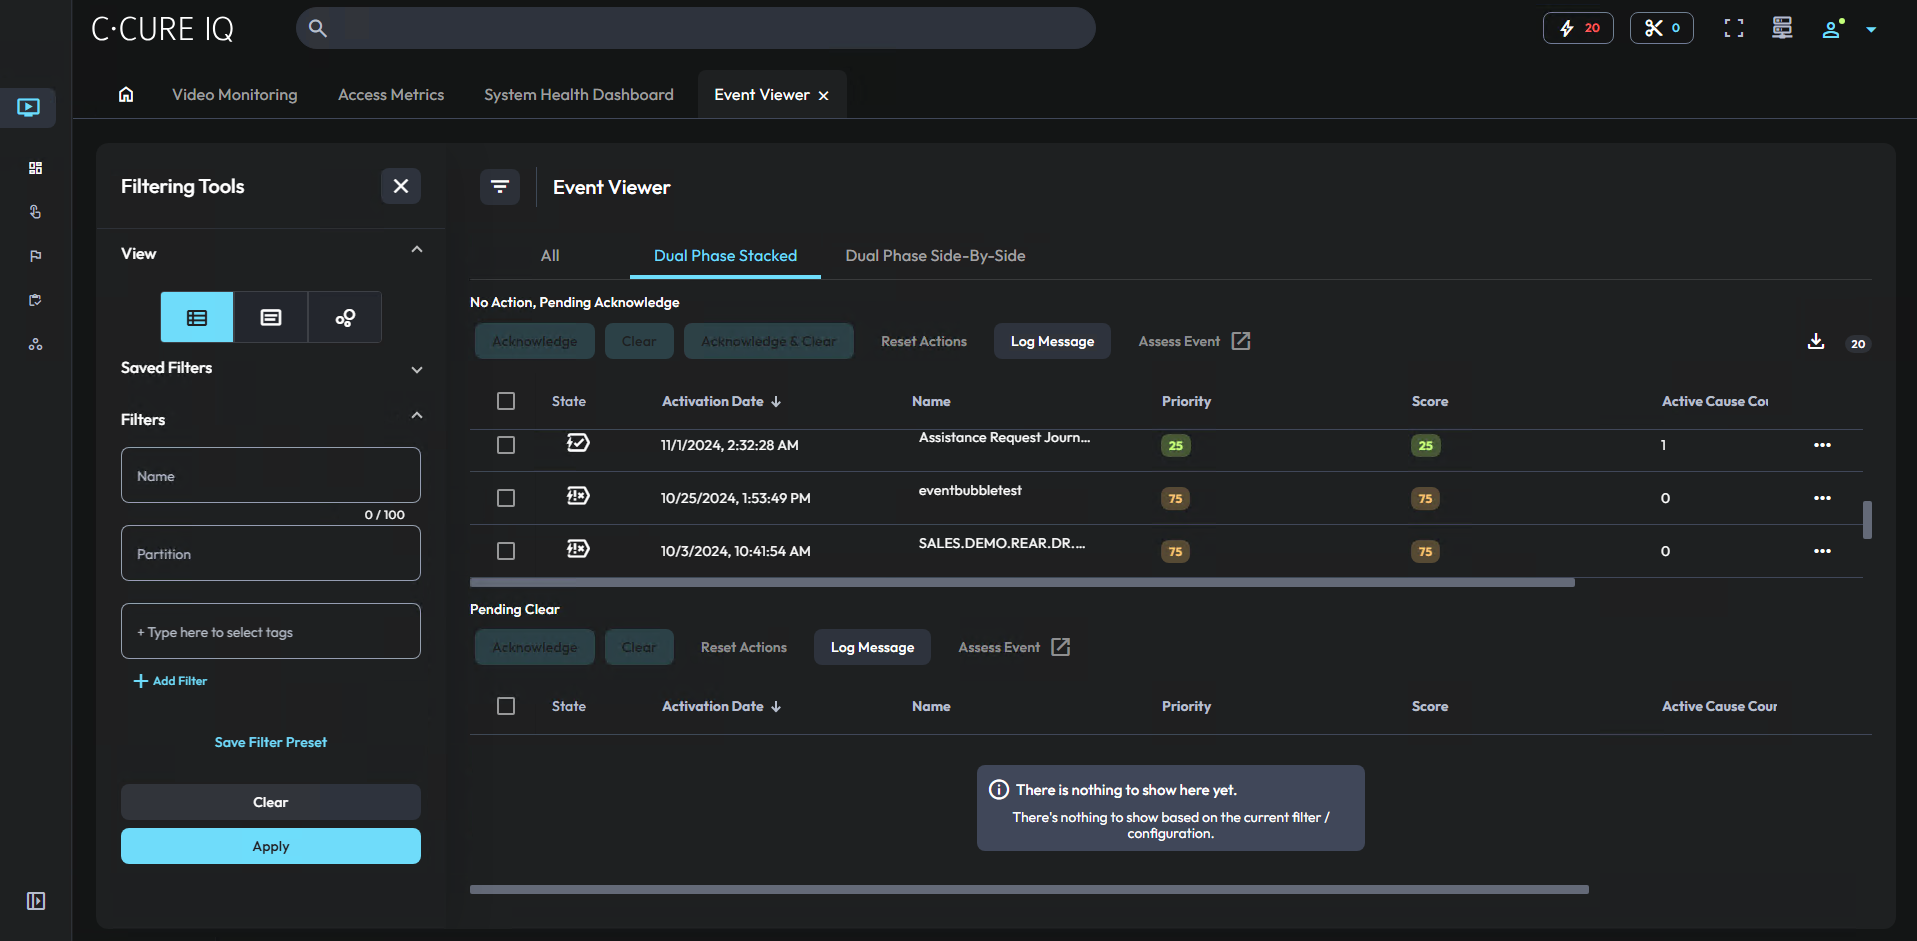
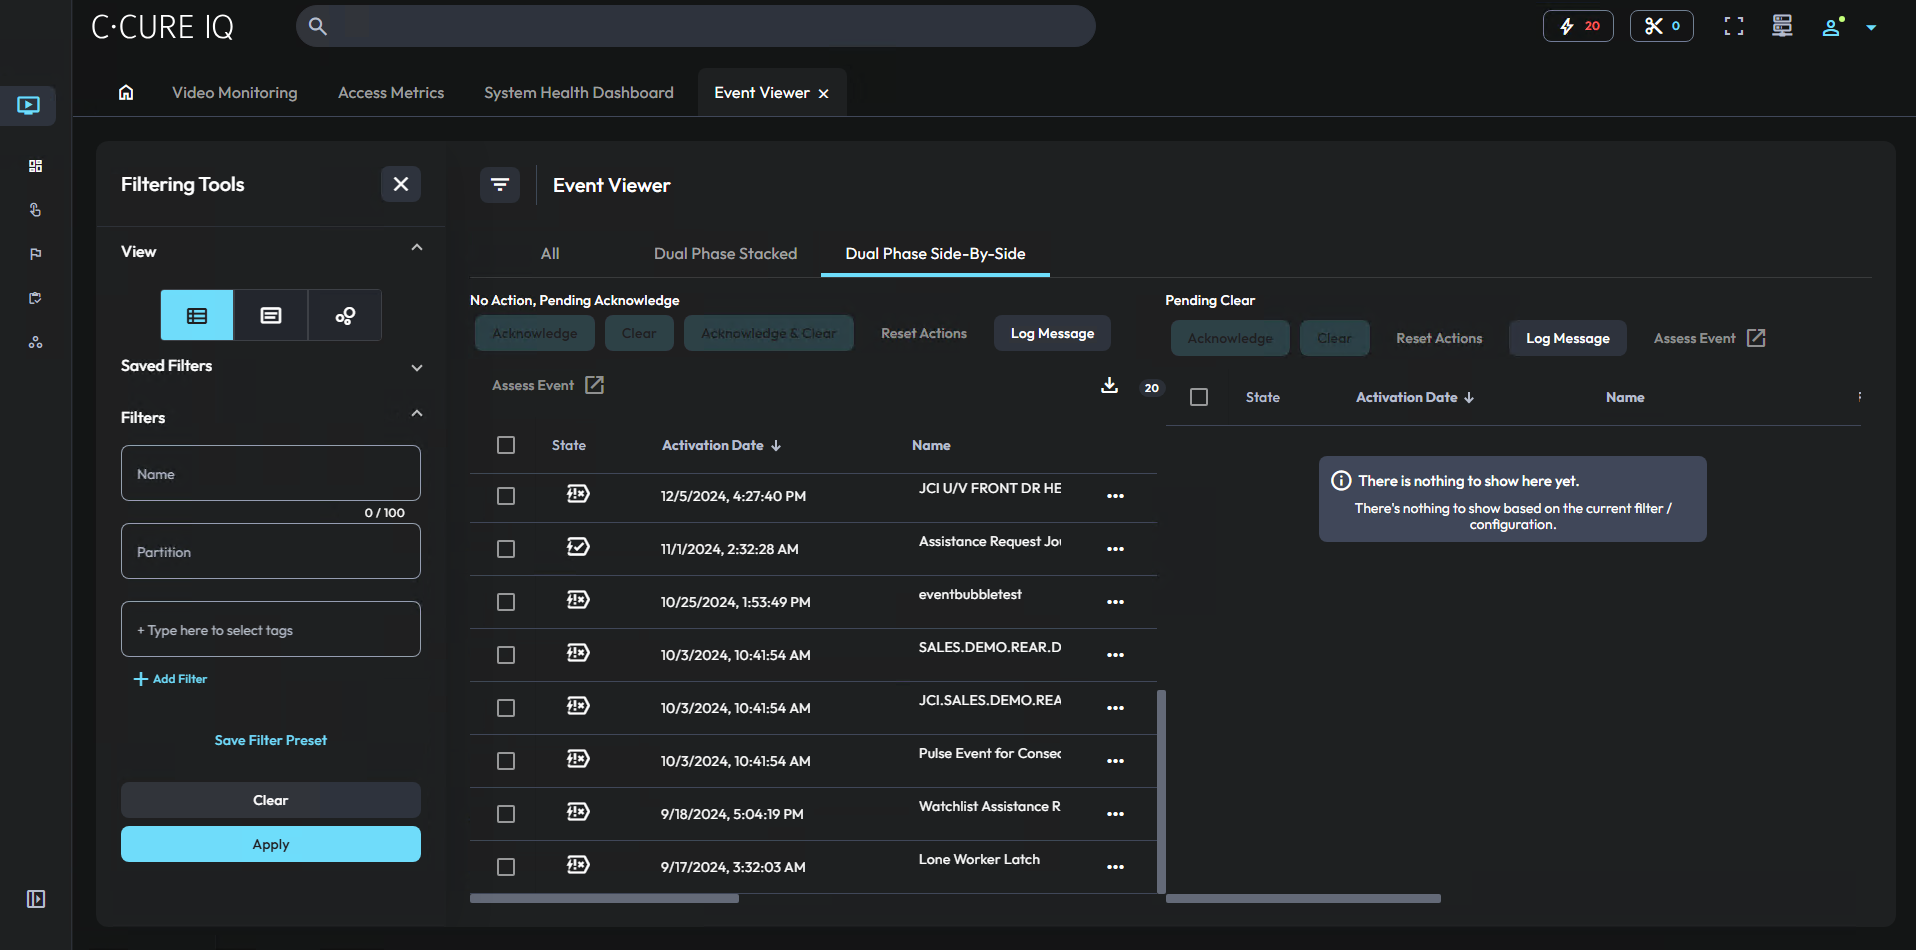
- Change the list format to Dual Phase Stacked or Dual Phase Side-by-side
Dual Phase Acknowledgment manages events by requiring that an event remain active after it is acknowledged until it is cleared. For more information about Dual Phase Acknowledgment, refer to the Monitoring Events chapter of the C•CURE 9000 Monitoring Station Guide.
When you use the Event Viewer’s List view, you can interact with events through the context menu, and through the toolbar icons. The following table lists the toolbar icons and the corresponding options from the context menu.
| Name | Description |
|---|---|
| Acknowledge | Acknowledge the selected events |
| Clear | Clear the selected events |
| Acknowledge and Clear | Acknowledge and clear the selected events |
| Reset Actions | Refresh the event list |
| Log Message | Log a message for the selected events |
| Assess Event | Open the Assess Event window, where you can view event information, and any video clips that are associated with the event. For more information, see Event assessment. |