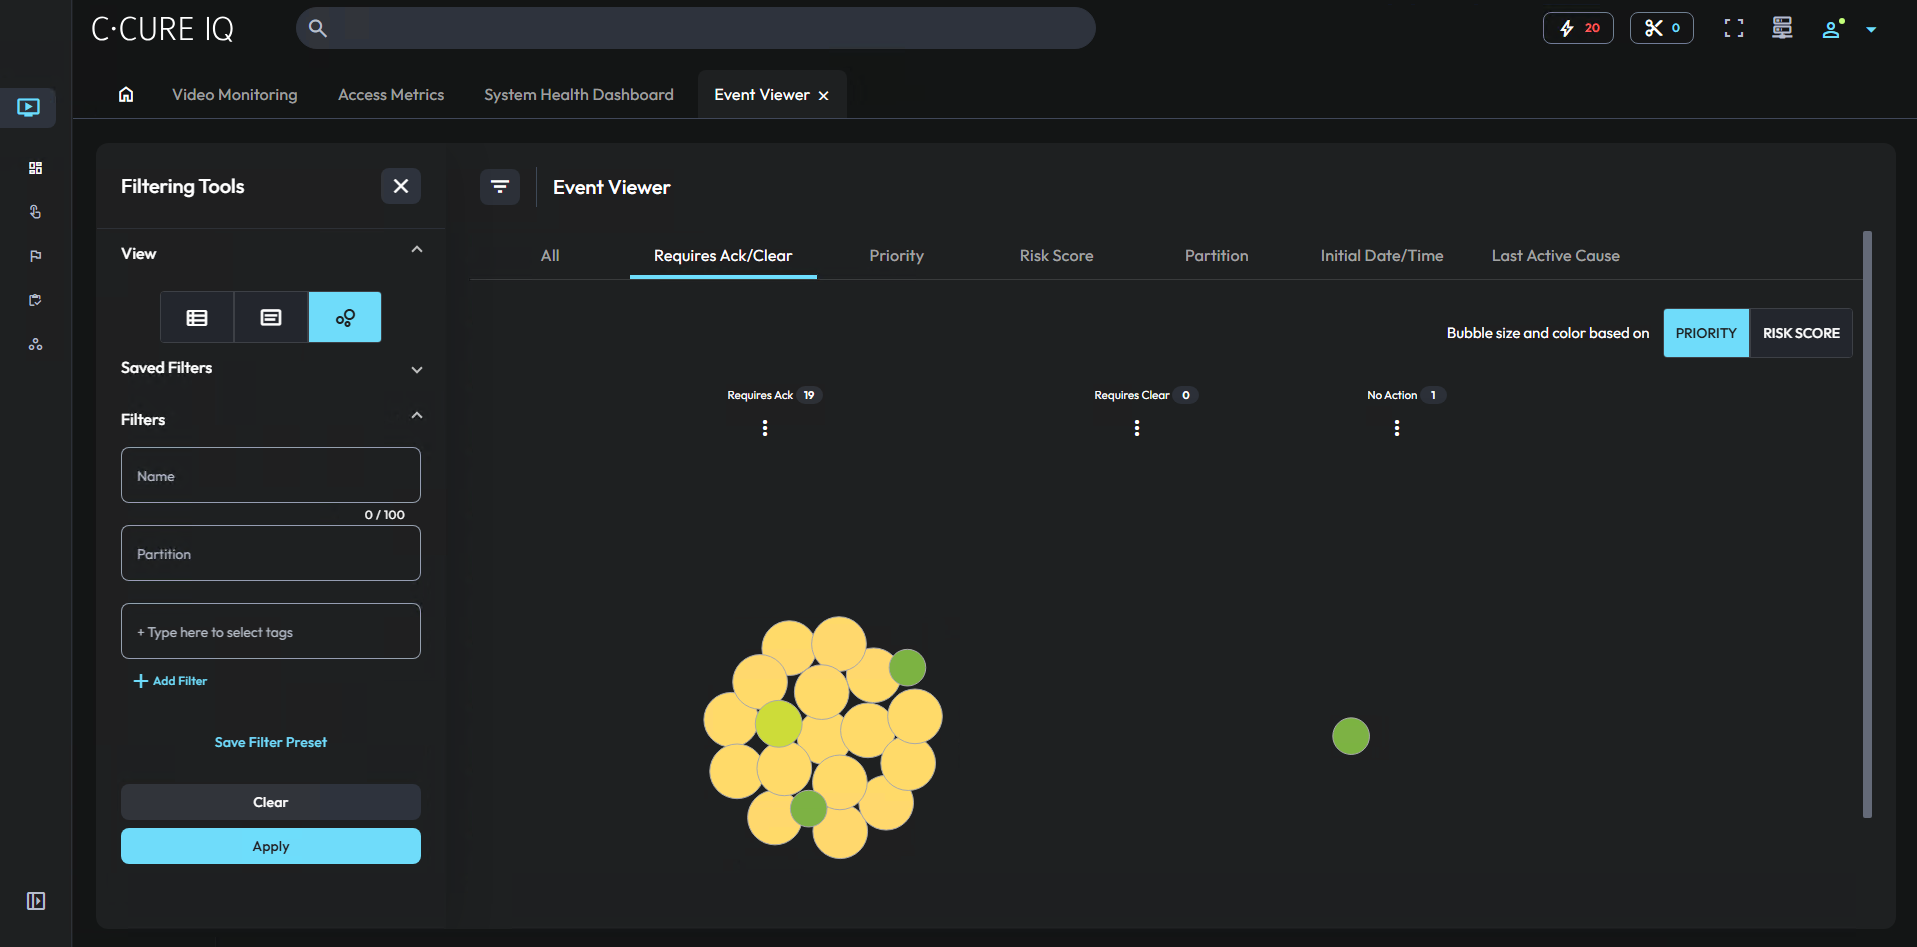
Bubble view
In the bubble view, events appear as groups of nodes. Event nodes are color-coded, and the node size and color are determined by the event’s priority or risk score.
You can display event information in the following formats:
- All
- Displays one group of nodes that represents all the events in your system.
- Requires Ack/Clear
- Displays event nodes in the following groups: Requires ack, requires clear, no action.
- Priority
- Displays event nodes in groups, based on the event priority
- Risk Score
- Displays the event nodes in groups, based on their risk score.
- Partition
- Displays event nodes in groups, based on their associated partition.
- Initial Date/Time
- Displays the events in groups, based on when they initially occurred: Past hour, past shift, past day, past week, or beyond past week.
- Last Active Cause
- Displays the events in groups, based on when they last occurred: Past hour, past shift, past day, past week, or beyond past week.
Note: The past shift option contains events from the
past eight hours.
You can hover over an event node to view the event’s name and priority. To perform an event assessment on an event, right-click that event. For more information, see Event assessment.