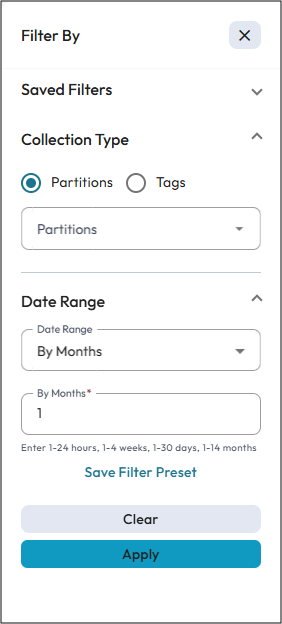
Filtering tools for alarm automation dashboard
| Filter options | Description |
|---|---|
| Saved Filters | Displays the list of filters you have saved for your reference. |
| Collection Type | Allow you to filter results using either
Partitions or
Tags.
|
| Date Range | Allow you to define a date range to further narrow down the
search based on Days/Weeks/Months/Hours/Custom (depends on the
license). It gives an aggregate report of the personnel that how frequently a person has been attended to the office premises in a particular date range. You can filter the attendance data for a particular date range and work type. |
| Save Filter Preset | Use this option to save applied filters. You can save multiple filters for your
reference and also delete them when not required. If you save a filter with specific values and log out the application, then logging on again to the application and navigating to the Alarm Automation Dashboard, lands you to the last saved filter data. This option is specific to the individual operator. When one operator creates a filter, it is not accessible to other operators. |
| Apply | Apply the filter based on the selected values and fetch the alarm automation data. |
| Clear | Clears all selected filter values and displays the default page view. |
Date range filter option allow you to fetch the alarm status data in a particular way. Once you specify the filters and apply them, you can view all the selected filters on the top bar on the filtered data window after closing the Filter By pane.
Providing the filters for Date Range, the system shows the following data:
- All alarms automated
- Alarms reduced
- Alarms escalated
- Alarms by date range
- Top N alarms by location
- Top N alarm metrics
- Rule activations
Following are some scenarios where you can see alarm automation status in a particular format:
Scenario 1: By Months
When you select Date Range as months, the system shows weekly basis data for one to two months of range. For more than two months, system displays monthly data.
You can view the data of up to 14 months (depends on the license).
Scenario 2: By Weeks
When you select the Date Range as week, the system shows daily basis data for one week. For more than a week, system displays weekly data.
You can view the data of up to 4 weeks.
Scenario 3: By Days
When you select the Date Range as days, the system displays hourly data for a single day. For more than a day, system displays daily basis data.
You can view the data of up to 30 days.
Scenario 4: By Hours
When you select the Date Range as hours, the system shows the data on hourly basis.
You can view the data of up to 24 hours.
Scenario 5: Custom
When you select the Date Range as custom from the drop down menu, the system allows you to set the Start Date and End Date to view the customize data.