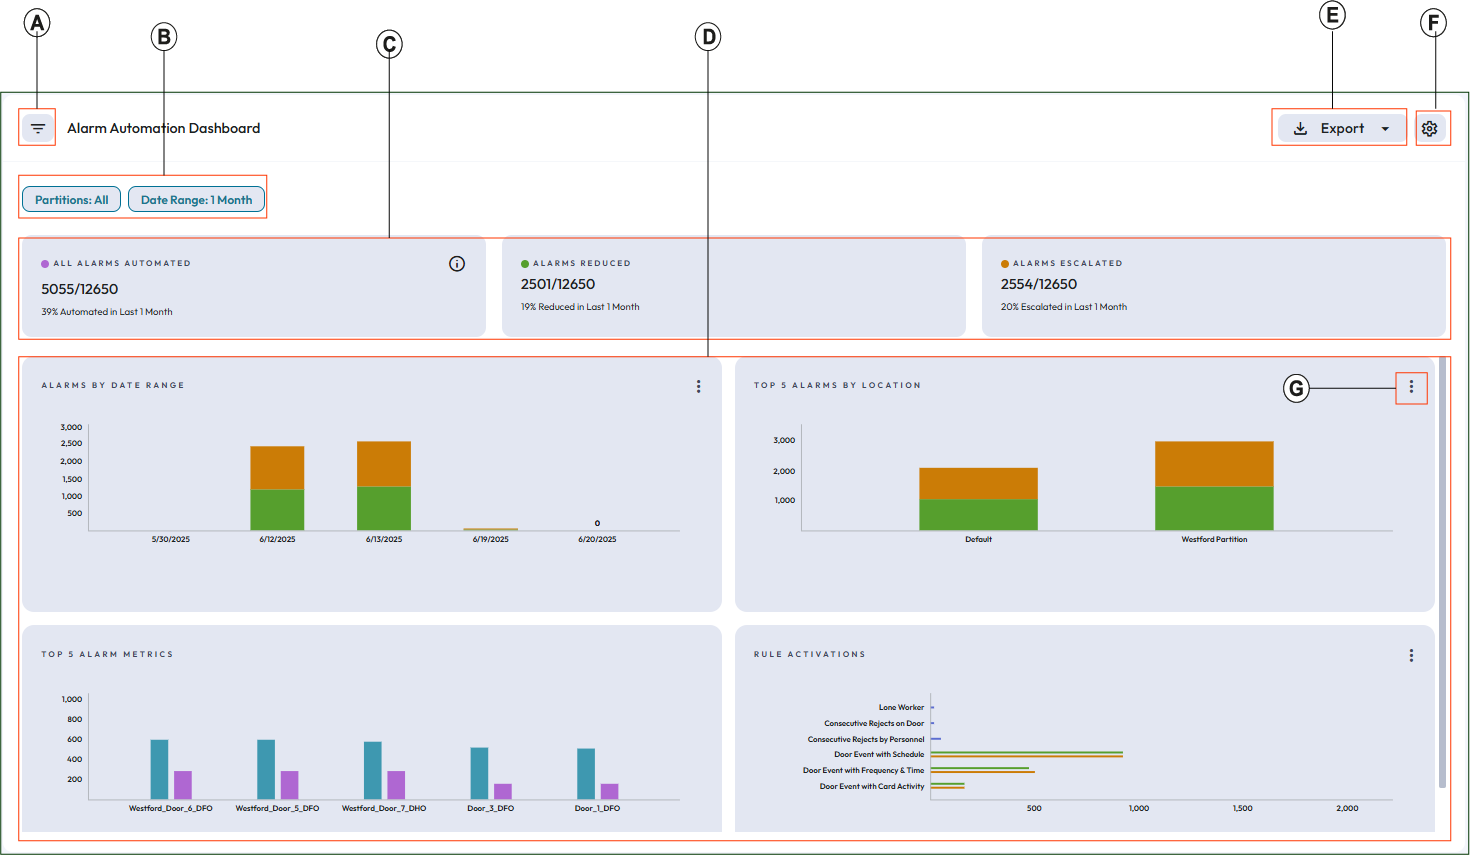
Alarm Automation Dashboard
Alarm Automation Dashboard allows you to get the aggregated report of Alarms which are or were automated. This dashboard provides alarm automation effectiveness to assess rule performance and identify opportunities to automate nuisance alarms. It helps to streamline alarm processes to reduce or escalate alarms based on user pre-defined rules. Key metrics such as Alarms Automated, Alarms Reduced, and Alarms Escalated offer insights into how well automation rules are managing door-related alarms.
- Automates alarm actions and responses based on the alarm events.
- Automates alarms work flows and responses to alarms.
- Generate automated notifications related to alarm activities.
- Analyze the effectiveness of automation rules in reducing alarm noise.
- Investigation of missed opportunities for automating nuisance alarms.
- Identify lone workers and associated alarms.
- Determine which doors or credentials generate frequent alarms and where they are occurring.
- No license - UI will display the error message
- Default month selected will be 1, if the license type is 1 (Default license supports 30 days).
- Default month selected will be 1, if the license type is 2 (Premium license supports 425 days).
If the operator has the necessary privileges assigned, they can have full access to the Alarm Automation Dashboard features.
Refer Privilege Permissions for the privilege permissions and grants.
You can access the Alarm Automation Dashboard using any of the following procedure:
- From the left panel, click Monitoring.
- Click Home icon available on the top left of the window.
- Click Alarm Automation Dashboard.
Or
- From the left panel, click .
| Callout | Description |
|---|---|
| A |
Show or hide the filtering tools. For more details on filtering tools, see Filtering tools for alarm automation dashboard |
| B | Filter chips: Once you specify the filters and apply them, you can view all the selected filters on the top bar of the filtered data window after closing the Filter By pane. |
| C | This section shows the alarm status cards based on the alarm automation rules. |
| D | This panel displays the graphical representation for alarm automation. |
| E | Export as PDF or CSV format. |
| F |
Settings Icon. Click this icon to configure the number of alarm category, partitions, and alarm types to
display.
Note: You can configure the
settings for 5 or 10. |
| G | View as table Each category displays “View as table” icon. Use this icon to view the graphical representation of respective category in table format.In table view, you can see the details about the alarms status. You can select Percentage View or Count view to change the view of the alarms status data. |
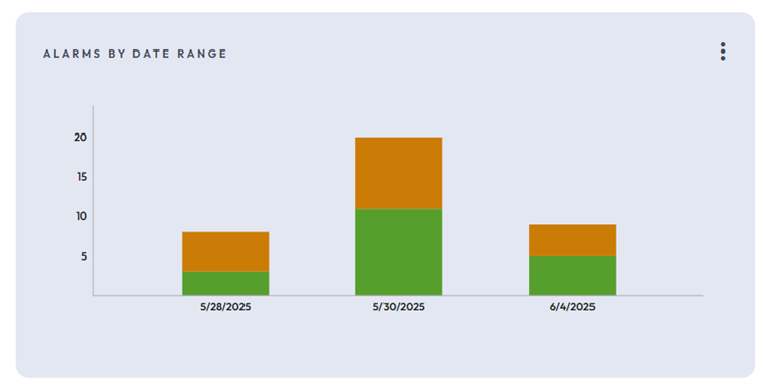
- Alarms By Date Range: This report shows the number of Alarm Automated in terms of
Reduce and Escalation.
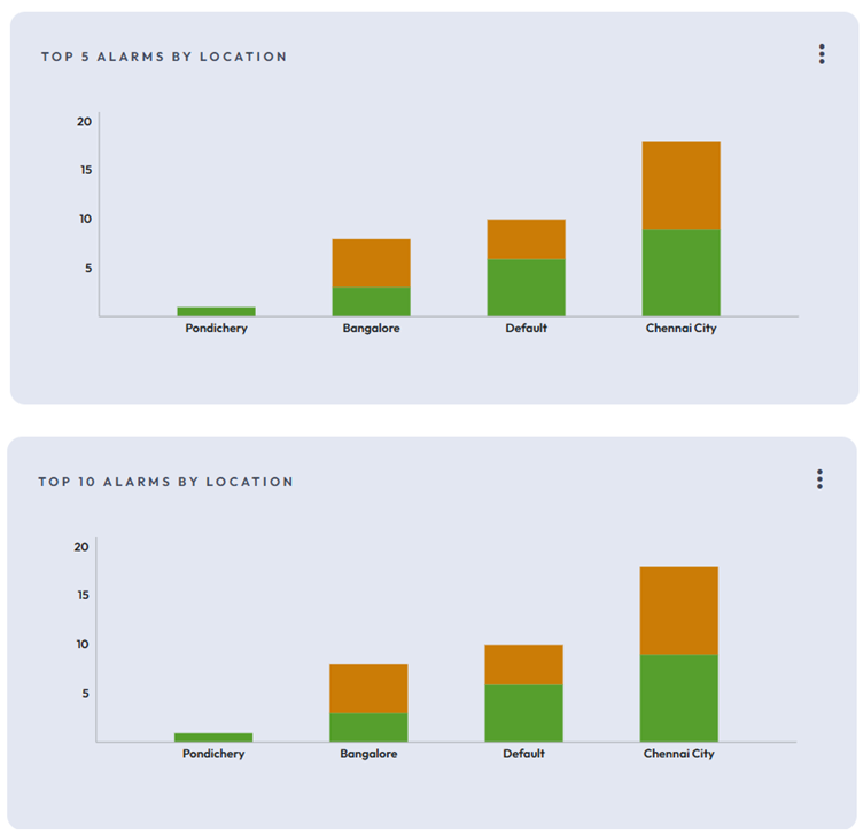
- Top N Alarms by Location: This report shows which location has the most alarms
automated in terms of Reduce and Escalate.
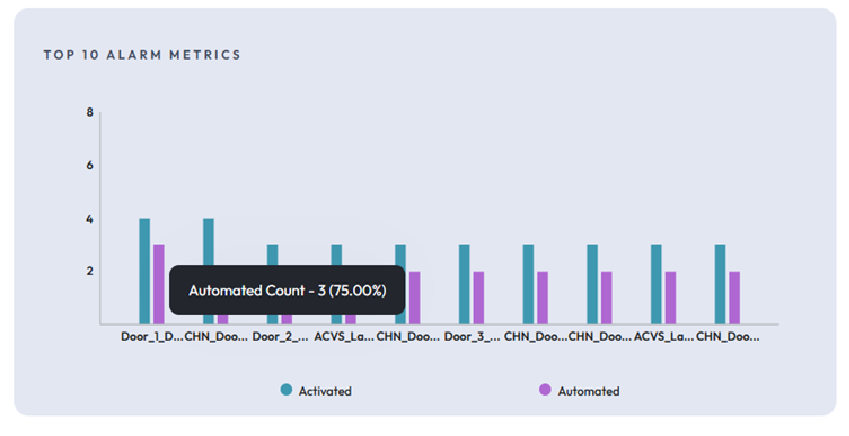
- Top N Alarm Metrics: This metric shows how many alarms have activated and how many
are automated.
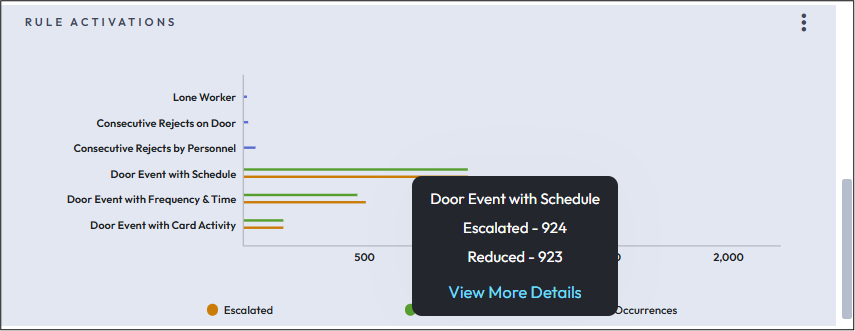
- Rule Activations: This activation shows which rules type has been activated by how
many times. Under RULE ACTIVATIONS section, hover over
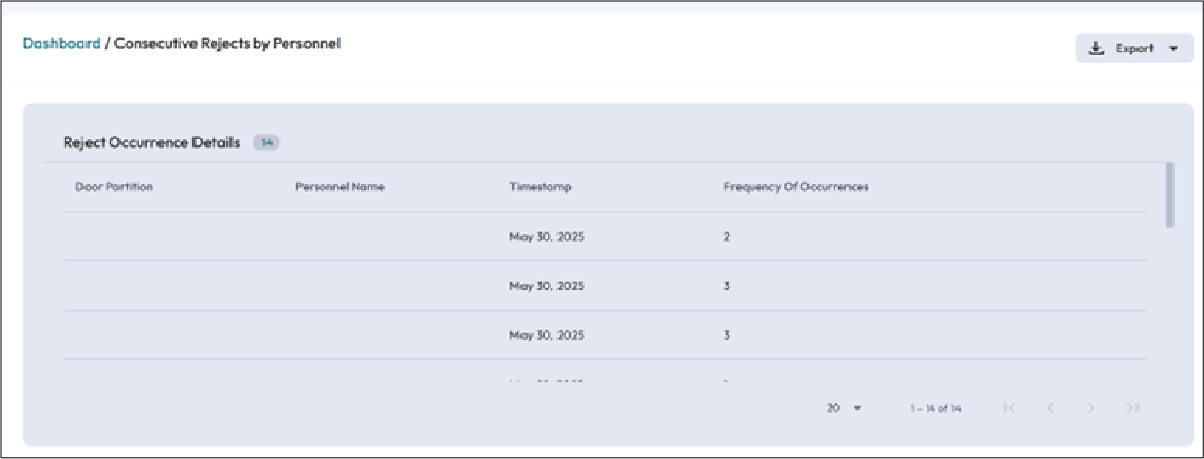
the cursor on any line of the chart to view the data in more details. Click
View More Details to view the door partition details
in tabular format along with expanded details like personnel name, timestamp,
and frequency of occurrences. You cannot modify these details.
 Note: If an operator has access privilege to certain partitions, the Rule Activations chart, Door Partition, and Personnel Name fields appear blank. This occurs when the associated Doors and Personnel belong to different partitions. Additionally, these fields may also be blank if the personnel record has been deleted or if the operator lacks the required access privileges.
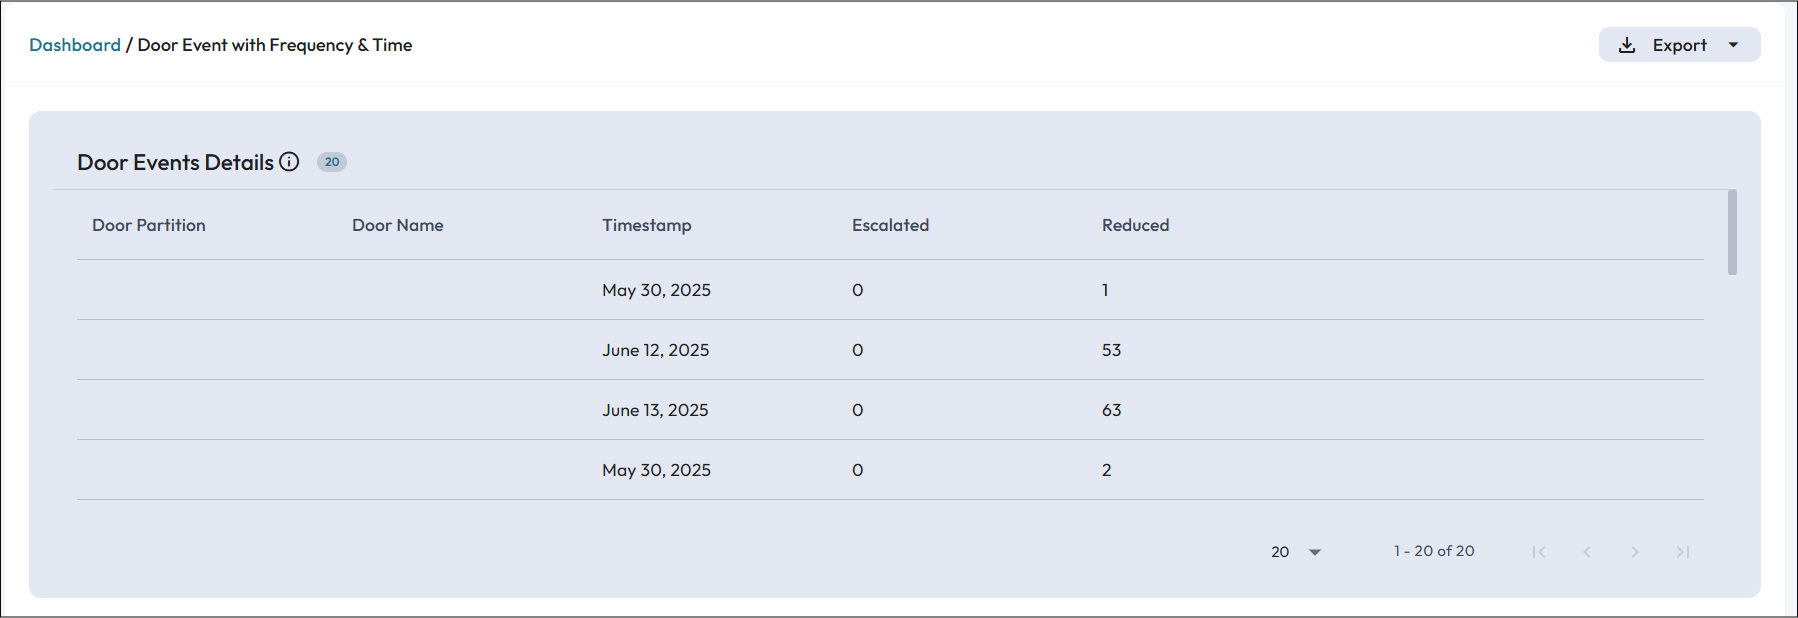
- Journal Log for Alarms: You can view journal logs for the alarm using
the tabular view of the data. Click Options icon under the
Actions column corresponding to the particular
partition and click Find in Journal.
Figure 2. Journal log for Alarms 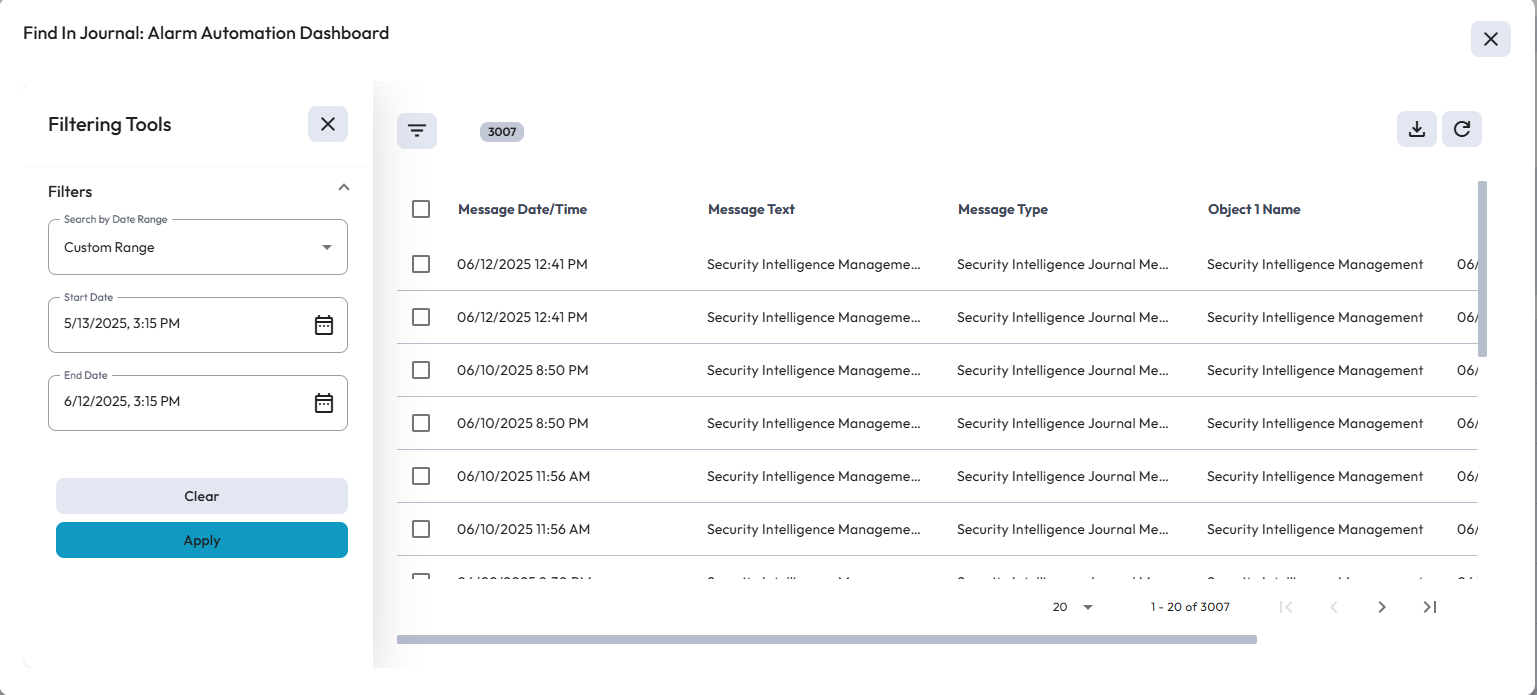 In journal log, you can apply following date range filter to narrow down the search details:
Table 2. Journal log date range filter Date Range Filters Description In Range Select Date and time from the drop down list to apply. Equals to Select the date and set up the time to view the journal log till that particular time. Greater Than Select the date and set up the time to view the journal log greater than that particular time. Less Than Select the date and set up the time to view the journal log less than that particular time. Custom Range Select date and time for the start and end date. Note: The journal message displays the Security Intelligence Journal Messages which also includes Synchronization messages.You can download the Journal logs either as PDF or CSV format. The downloaded journal are based on pagination. Default pagination is 20 and if you select download option (either PDF or CSV) then the first set of results based on pagination will be downloaded. You can click next pagination to download the result.