Alarm Dashboard
Alarm Dashboard focuses on analyzing alarm data to identify patterns, prioritize responses, and differentiate between nuisance and genuine alarms.
- Overview of alarm patterns:
- Identification of top alarms by frequency and source.
- Analysis of alarm frequency across different partitions and tags.
- Highlighting the most frequent alarm types and their sources.
- Detection of partitions with the highest alarm activity.
- Visualization of alarm trends over time.
- Drill-down analysis:
- Deep dive into alarm journals to assess context and recurrence.
- Classification of alarms as nuisance (repetitive, low-risk) or real (critical, actionable).
- Tag-based and partition-based filtering for targeted investigation.
If the operator has the necessary privileges assigned, they can access all alarm dashboard features fully.
Refer Privilege Permissions for the privilege permissions and grants.
You can access the Alarm Dashboard using any of the following procedure:
- From the left panel, click Monitoring.
- Click home icon available on the top left of the window.
- Click Alarm Dashboard.
Or
- From the left panel, click .
- No license - UI will display the error message
- Default month selected will be 1, if the license type is 1 (Default license supports 30 days).
- Default month selected will be 1, if the license type is 2 (Premium license supports 425 days).
The default view of Alarm Dashboard is:
| Callouts | Description |
|---|---|
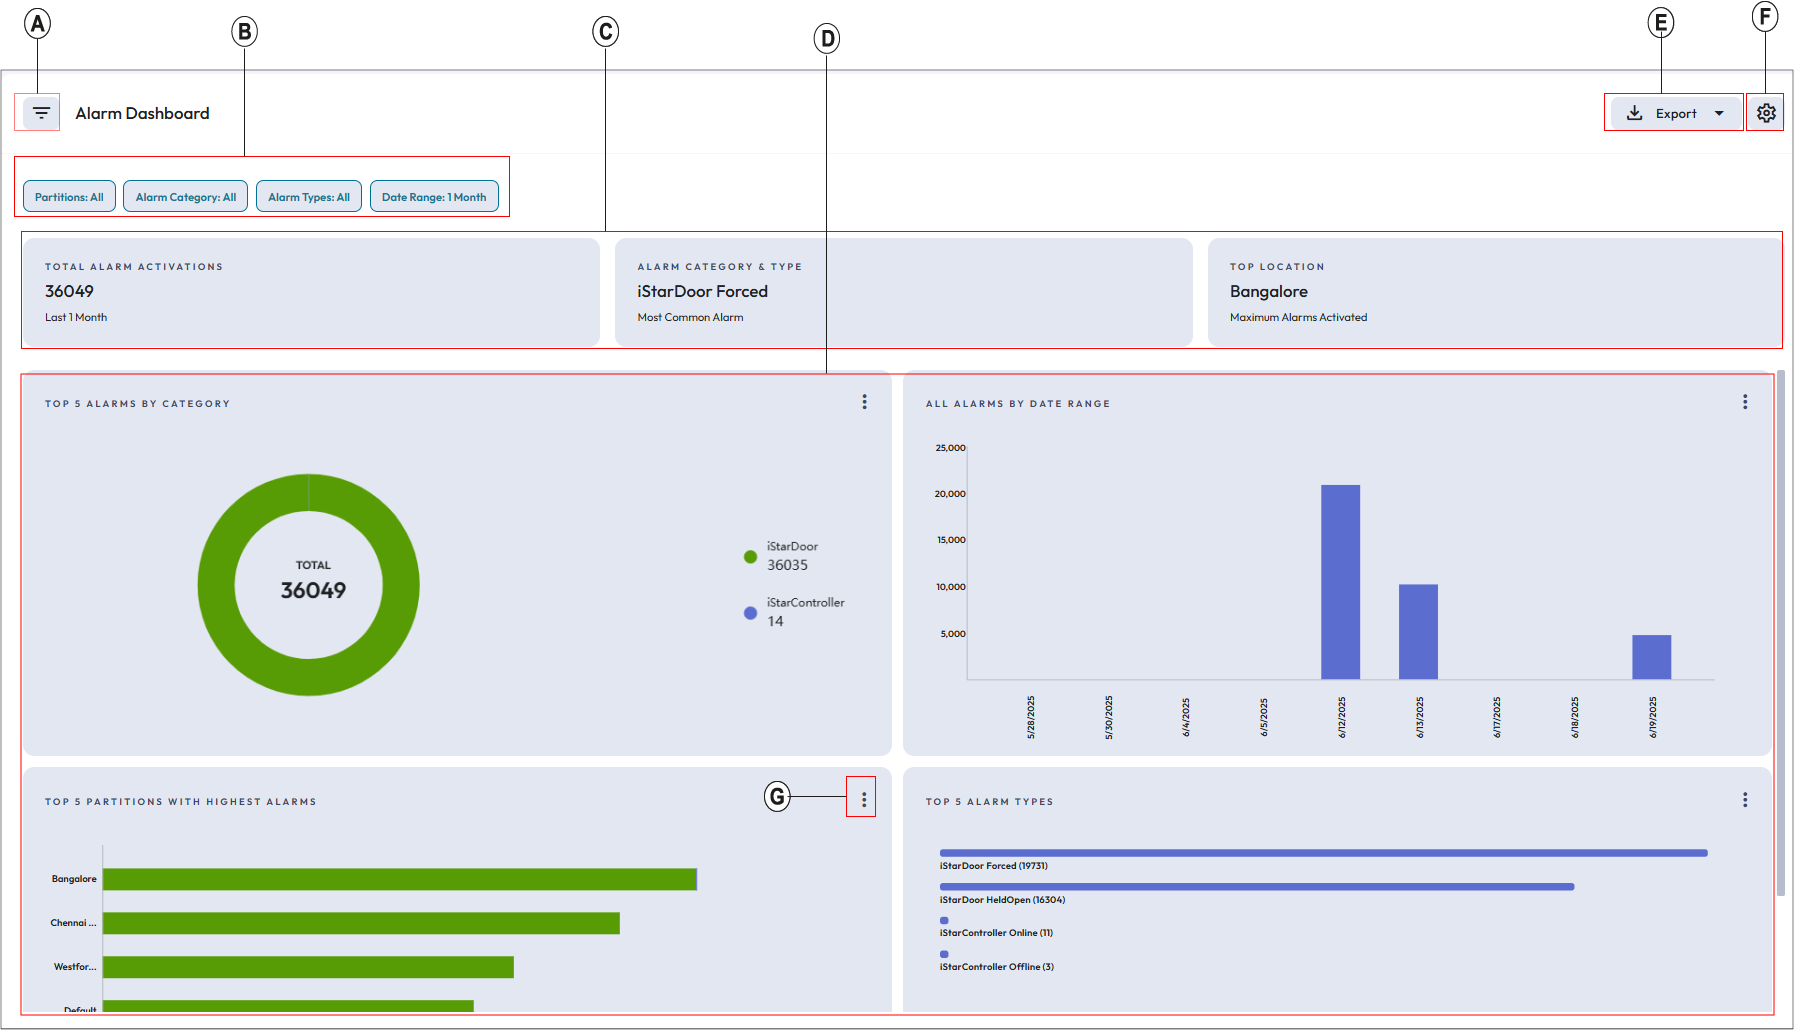
| A |
Click this icon to show or hide the filters. |
| B | Filter chips: Once you specify the filters and apply them, you can view all the selected filters on the top bar of the filtered data window after closing the Filter By pane. |
| C | Alarm Status Data Card: This section shows the following alarm status cards based on
the most common alarms:
|
| D | This panel displays the graphical representation for most common alarms. |
| E | Export as PDF or CSV format. |
| F |
Configuration icon. Click this icon to configure the number of alarm category, partitions, and alarm types to display. By default, the system sets the value for configuration to 5. You can change it to 10. |
| G | View as table Each category displays “View as table” icon. Use this icon to view the graphical representation of respective category in table format.In table view, you can see the details about the partitions, alarm status, and the corresponding actions. |
Journal logs for alarm: You can view actions taken in the activity journal for each alarm type in each partition. This helps you to track responses to each alarm. Click Options icon under the Actions column corresponding to the particular partition and click Find in Journal.
| Date Range Filters | Description |
|---|---|
| In Range | Select Date and time from the from down list to apply. |
| Equals to | Select the date and set up the time to view the journal log till that particular time. |
| Greater Than | Select the date and set up the time to view the journal log greater than that particular time. |
| Less Than | Select the date and set up the time to view the journal log less than that particular time. |
| Custom Range | Select date and time for the start and end date. |
You can download the Journal logs either as PDF or CSV format. The downloaded journal are based on pagination. Default pagination is 20 and if you select download option (either pdf or csv) then the first set of results based on pagination will be downloaded. You can click next pagination to download the result.